Monday, June 29, 2009

EUR/USD: Standing Aside


As I am writing this post price is breaking through neckline of Head And Shoulder pattern. I will go long after a retest of this level with a target of 1.4260 which is the 161.8 Fib level. If price fails to hold above the 1.4118 after a break I will look to take a small short. Stay tunes for live trade updates on twitter.

Thursday, June 25, 2009

EUR/USD: Long @ 1.4003


I have been out of the market for some time. I took a long position in the EU after the upper trend line proved to be strong support with two four hour candles failing to close below it (see H4 chart). I also noticed a Head and Shoulders reversal pattern depicted in H4 chart. I will take some profit if and when price reaches the neckline. If price violates and retests the neckline as support I will move my stop up about 30 pips below the neckline. Alternatively, I will be looking to go short if price breaks and retests 1.3747 level. Stay tuned to twitter for live trade updates.

Tuesday, June 23, 2009

EUR/USD: Standing Side with short term bullish bias; -42 pips last trade


Economic data out of the Eurozone and the United States weighed the dollar down today. US existing home sales increased for the second month in May. European purchasing manger indexes shrank by the least amount since the inception of the recession. As a result, risk appetite increased which always hurts the dollar. I was stopped out on my last trade for a -42 pip loss. I will be looking to go long, as long as price finds support at the 1.400 level which corresponds with the 38.2 Fibonacci retracement level at 1.4001. The bullish triangle reversal pattern played out today with a break of the upper trend line of that formation (See 1 hour H1 chart). My target if this plays out will be 30 pips below the 138.2 Fibonacci extension level at 1.4186. I will be looking to short the Euro at this level. Stay tuned on twitter for real time trade updates.

Monday, June 22, 2009

EUR/USD: Short @ 1.3863


I waited to go short until I got more of a signal from price action. I entered at 1.3863 and my overall target will be 1.3500. I plan on taking some profit at 1.3760 and brining my stop down if price makes it there. I may add more to the position after a break and retest of 0.0 Fibonacci level at 1.3745. The weekly and daily stochastics are currently in bearish cycles, which support bearish bias at the moment. Stay tuned on Twitter for live trade updates.

Thursday, June 18, 2009

EUR/USD: Standing Aside


I haven’t posted for the last two days because I was sick. I am standing aside for now because it has been pretty tough to determine a clear direction in the EU. The EU is currently trading in a bullish ascending channel depicted on 1 hour chart (H1) and a hammer just printed on H1. My plan is to short EU at 61.8% retracement (1.4012) with a target of 1.3750. The daily chart stochastics have begun a bullish cycle but price remains below the 21 exponential moving average (EMA). I would suggest “sitting tight” until price reaches upper trend line of triangle depicted on H4 and daily stochastic finish current bullish cycle. I plan on adding GBP/JPY analysis to my blog posts as soon as I become more comfortable trading this pair. Stay tuned on twitter for real time trade updates.

Monday, June 15, 2009

EUR/USD: The Bears are in control!!!!


I closed first trade for +172 pips and reentered after the neckline of head and shoulders was broke and retested. Today there was plenty of data and comments that were USD bullish. The Russian Finance minister said the dollar was in “good shape” which started bullish momentum of the dollar. In addition, the number of people working in the eurozone declined by 1.2% which didn’t bode well for the Euro. Furthermore, data released out of the US today was worse than expected which encouraged the market to be risk averse giving the dollar a boost.

The neckline of the Head and Shoulders was violated before noon EST. Price has been able to remain under the neckline for now. If price remains below the neckline I will use the 261.8 Fibonacci extension level for my final target at 1.3589. If not, I will redraw a Fib and wait to see where price retraces to define my target. Stay tuned on twitter for real time trade updates.

Sunday, June 14, 2009

EUR/USD: Weekly Technical Outlook


My last trade didn’t work out -36 pips. I am cautiously bearish. The EU seems to be losing steam to the upside, as evidenced by the Head and Shoulders (H&S) pattern on the four hour chart (H4), diminishing volume as price rises, and the confirmed bearish divergence (price making higher high; indicator failing to make higher high) in OSMA (H4). In addition, stochastics on the weekly chart are about to start a bearish cycle. Furthermore, price failed to break through the 50.0 Fibonacci level of the (1.6036 – 1.2321) Fib depicted on weekly chart. If we get a break and retest of the neckline of the H&S pattern around 1.3820 my overall target will be 1.3600 which is the 138.2 Fibonacci extension level of the (1.4337 – 1.3809) Fib depicted on daily. I expect price to find a lot of support around the 1.3800 level so you may want to break this trade up just to be safe.

Alternatively, if price manages to break the 1.4143 level and retests this level as support I will be looking long, with an overall target of 1.4500.

Thursday, June 11, 2009

EUR/USD: Long @ 1.4107


I took a small long @ 1.4110 after I noticed that price found a lot of support right around 38.2 Fibonacci level and 200 day(red) simple moving average (SMA). My target is 20 pips below the 138.3 Fibonacci extension level @ 1.4248. I got a good risk reward on this trade and plenty of technical reasons to enter. Daily stochastics are currently in a bullish cycle and the daily OSMA just printed dark red bar. Nevertheless, I did place a tight stop because there is plenty of resistance for price to break through.

The fundamentals are also supporting this trade at the moment. All of the economic data that came out today supported that the economic contraction may be subsiding. As a result, the risk appetite of the market increased which hurts the value of the dollar.

Tuesday, June 9, 2009

EUR/USD: Neckline of Head & Shoulders Retested


I am short @ 1.4070 as I planned last weekend. I placed my stop above the neckline of the Head and Shoulders (H&S) depicted in the one hour charts (H1) that I attached to this post. I attached the H1 chart from the weekend to show what a retest looks like. When a significant technical level like a neckline of a H&S is violated it is usually retested. Well, that it was we got today and if it holds as resistance my target will be 1.3820. If this trade works out I will post to twitter when I move my stop down.

I want to thank everyone that has provided me with feedback. It is greatly appreciated and it has helped me improve my trading and this blog. I hope my commentary has helped.

Monday, June 8, 2009

EUR/USD: Standing Aside +61 pips today

I am standing aside for now. I will be watching how price behaves as it retests bottom trend line of ascending channel. I am still looking to short but am remaining cautious due to the possible hammer bottom forming on daily. I will feel more comfortable shorting as long as price remains below the 21 exponential moving average (EMA) on daily chart. I am posting my trades in real time on twitter so stay tuned.

Sunday, June 7, 2009

EUR/USD: Weekly Technical Outlook


I closed out my last trade of the week on Friday for +80 pips. I will be looking to short EU early in the week. Price may retrace up to the 1.4050 or the 1.4100 zone before continuing with the bearish correction. I will be paying close attention to how price behaves around the 200 day simple moving average (SMA) on the 1 hour chart (H1). The 200 SMA is also hanging around the 50.0 Fibonacci retracement level. I really like to trade that level because many traders pay attention to that Fibonacci level. Price is approaching a critical level in the 21 day exponential moving average (EMA) on the daily chart, which almost corresponds with the bottom trend line of the ascending channel. Volatility increases around critical levels like this so it may be prudent to stay on the sideline until price demonstrates where it is headed from there. We may get the upside correction from there to the 1.4050 or the 1.4100 level.

Trade Idea: Wait for upside correction to 1.4050 – 1.4100 level Short EU with target of 1.3815

Thursday, June 4, 2009

EUR/USD: +26 pips today; Standing aside for now


I am standing aside for now. I am still looking to short the EU. Notice the Head & Shoulders reversal pattern I have highlighted on 1 hour chart (H1). If and when we get a break of that neckline EU should gain bearish momentum. If EU doesn’t break the neckline and heads north I will be looking to take a small short when price reaches 1.4326 level. I would also like to mention that the ECB stated that “Euro rise is not welcome.” The ECB also “left the door open for further rate cuts.”

Wednesday, June 3, 2009

EUR/USD: The Power of Fibonacci Retracement/Extensions +78 pips Today


I wanted to use the latest ABCD move the EU made in the last couple of weeks to explain how I use Fibonacci retracement/extensions to set my profit targets and to demonstrate just how useful Fibonacci levels can be. Take a look at the daily chart. As you can see, after price reached the 1.4050 area on 5/24 (A-B) it retraced to 1.3812 (B-C) which is the 38.2 retracement level. A 38.2 retracement means that if price breaks the 0.0 fib level after the retracement and retests this level your target (C-D) is the 138.2 extension level which is 1.4295. Price did exceed the 138.2 fib level by about 40 pips but that is a pretty big move.

I am standing aside for now. I don’t like to have any positions open before rate announcements unless I have locked in some profit because of the volatility before, during and after the announcement. I will continue to look short as long as the 21 exponential moving average (EMA) holds as resistance on the H4. I am now posting my trades in real time on twitter.

Tuesday, June 2, 2009

EUR/USD: Short @ 1.4318 last long +120 pips


I demo traded counter trend trades successfully for 6 months and just recently started taking live counter trend trades. I have been updating my trades in real time on twitter so you can follow them there. Price reached top of ascending channel on daily which also corresponded with the 138.2 Fibonacci extension level. There are bearish divergences in OSMA in Daily and H4 charts and stochastics look set for a bearish cycle. I got plenty of reasons to take this short. Target is 1.4250. I will not be taking any longs any time soon and may look to take another short if price reaches December highs around 1.4460 area. I will keep you posted.

Sunday, May 31, 2009

EUR/USD: Weekly Technical Outlook; Buy on Pullback to 1.4050


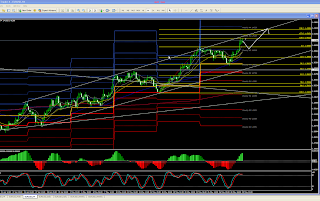
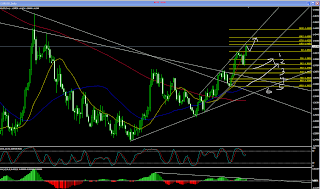
I am going to stand aside for now and wait for a pullback to 1.4050 before going long. I have got many questions asking how I determine overall direction. I use moving averages (21 EMA, 50SMA, 200 SMA) and where there are pointing on "the clock" on the daily chart to determine whether price is in a downtrend, uptrend, or trending. If you look at the daily chart I attached to this post, you will notice that I drew the numbers 1-6 as they would be on a clock. When the 21 EMA(yellow) and 50 SMA(blue) are pointing to the 1:00 - 2:00 area of "the clock" price is in a uptrend. If trend lines were pointing at 3:00 region of "the clock" I would determine that price is in a range. If trend lines were pointing 5:00 - 6:00 area of "the clock" price is in a downtrend. And notice how the 21 EMA is above the 50 SMA, which is above the 200 SMA; this is also an indication that price is in a uptrend. As a result of these indications, and the fact that EU broke through a lot of technical resistance last week, I am bullish EU and have determined that EU is in a uptrend. This means I am looking only to take long positions. I do consider counter trend trades when I see bearish divergences forming on upper time frames and stochastics are overbought/oversold on all time frames, but this is rare.


Weekly Strategy: Buy on dips with overall target at the 138.2 FIB extension level @ 1.4290