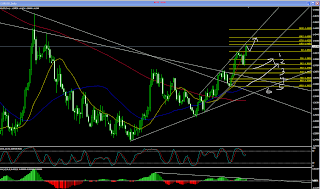

I am going to stand aside for now and wait for a pullback to 1.4050 before going long. I have got many questions asking how I determine overall direction. I use moving averages (21 EMA, 50SMA, 200 SMA) and where there are pointing on "the clock" on the daily chart to determine whether price is in a downtrend, uptrend, or trending. If you look at the daily chart I attached to this post, you will notice that I drew the numbers 1-6 as they would be on a clock. When the 21 EMA(yellow) and 50 SMA(blue) are pointing to the 1:00 - 2:00 area of "the clock" price is in a uptrend. If trend lines were pointing at 3:00 region of "the clock" I would determine that price is in a range. If trend lines were pointing 5:00 - 6:00 area of "the clock" price is in a downtrend. And notice how the 21 EMA is above the 50 SMA, which is above the 200 SMA; this is also an indication that price is in a uptrend. As a result of these indications, and the fact that EU broke through a lot of technical resistance last week, I am bullish EU and have determined that EU is in a uptrend. This means I am looking only to take long positions. I do consider counter trend trades when I see bearish divergences forming on upper time frames and stochastics are overbought/oversold on all time frames, but this is rare.
Weekly Strategy: Buy on dips with overall target at the 138.2 FIB extension level @ 1.4290


